All About Our Trinity Portfolios
“How many Trinity Portfolios are there? And how do I know which one is right for me?”
Fortunately, the answers are simple.
In order to meet the varying investing preferences of our clients, we offer six unique Trinity Portfolios. You might think of them as sitting along a continuum, ranging from most conservative (Trinity 1) to most aggressive (Trinity 6).
All six portfolios are similar in that they share the same foundational building blocks of our Trinity strategy: 1) assets diversified across a global investment set, 2) tilts toward investments exhibiting value and momentum traits, and 3) exposure to trend following.
The differences between the portfolios stem from how much of each building block you’ll find in each specific portfolio. In other words:
- What’s the specific asset mix in any given portfolio?
- How much exposure to trend following is in any given portfolio?
The Differences in Our Six Trinity Portfolios
On the conservative end of our continuum (Trinity 1), you’ll find the asset mix dominated by bonds, an asset that, historically, can be less-volatile. As to the second question above, Trinity 1 contains the least exposure to trend following, and instead, is more of a buy-and-hold portfolio.
Investors who prefer Trinity 1 are likely more conservative in nature, focused less on maximizing returns and more on minimizing portfolio volatility.
On the aggressive end of our continuum (Trinity 6), you’ll find the asset mix dominated by stocks, an asset that, historically, can be more volatile yet able to generate greater gains. Trinity 6 also contains the greatest exposure to trend following.
Investors who prefer Trinity 6 are likely more aggressive in nature, preferring to target greater returns even though they may be accompanied by increased portfolio volatility.
Trinity Portfolios 2 – 5 fill in the continuum from conservative to aggressive. The version we highlight in our Trinity Portfolio research paper most closely resembles Trinity 4. (We encourage you to read this paper if you haven’t done so. You can download it by clicking here.)
If you’re interested in additional information on each Trinity portfolio in order to help you make the right investment choice, we’ll provide more data below. But please know that this isn’t a decision you’ll need to make alone.
You see, our sign-up sequence will ask you a handful of questions designed to help us steer you toward the right Trinity portfolio. Additionally, we’ll share a short phone call with you as you open your account to make sure your specific Trinity portfolio matches your investing goals and style.
That said, below are more details explaining the differences between our six Trinity Portfolios; specifically, the approximate allocations we expect over time. Please take into account that these are averages, and since our portfolios are dynamic, the exact amount will shift.
We’ll start with a chart that compares all six Trinity portfolio for easy side-by-side comparison.

Here’s another way of viewing the same information that’s a bit more visual.
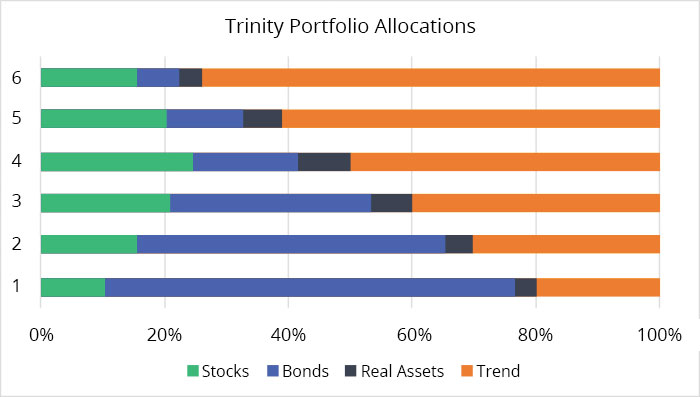
The Allocations of Our Six Trinity Portfolios
Below is a graphical breakdown of each Trinity Portfolio’s asset allocation. The stated percentage of “stocks,” “bonds,” and “real assets” represents the amount of each asset class you’ll find in the portfolios on a fixed “buy-and-hold” basis.
Please note that the “Trend Following” category is also comprised of “stocks,” “bonds,” and “real assets.” However, because trend is an active, dynamic strategy, each Trinity portfolio may allocate more or less to the respective asset classes given market conditions. It’s a fluid, responsive allocation. Therefore, for our purposes here, we present only the total percentage of trend-exposed assets you’ll find in each respective Trinity portfolio.
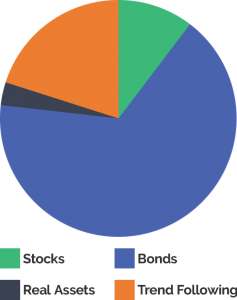
Trinity 1:
Stocks: 10%
Bonds: 66%
Real Assets: 3%
Trend Following: 20%
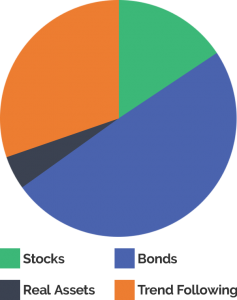
Trinity 2:
Stocks: 16%
Bonds: 50%
Real Assets: 5%
Trend Following: 30%
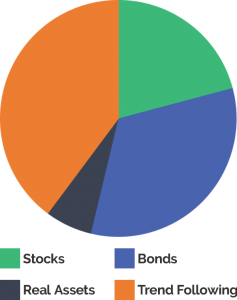
Trinity 3:
Stocks: 21%
Bonds: 33%
Real Assets: 6%
Trend Following: 40%
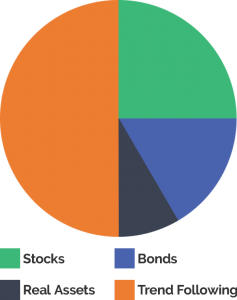
Trinity 4:
Stocks: 25%
Bonds: 17%
Real Assets: 8%
Trend Following: 50%
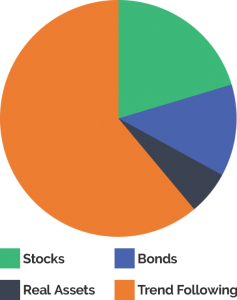
Trinity 5:
Stocks: 20%
Bonds: 12%
Real Assets: 6%
Trend Following: 61%
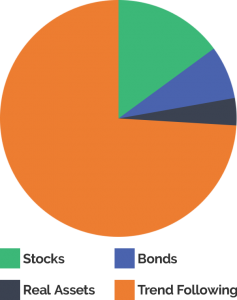
Trinity 6:
Stocks: 15%
Bonds: 7%
Real Assets: 4%
Trend Following: 74%
The Average Fees of the Underlying ETFs in Our Trinity Portfolios
Below are the average fees by portfolio. Please note that these underlying fund fees are estimates based on target allocations and current expense ratios. Market fluctuations will result in deviations from target allocations, which may impact underlying fund fees for the portfolios.
| Trinity 1 | Trinity 2 | Trinity 3 | Trinity 4 | Trinity 5 | Trinity 6 | |
|---|---|---|---|---|---|---|
| Total Expense Taxable | 0.47% | 0.55% | 0.63% | 0.71% | 0.76% | 0.82% |
| Total Expense Tax Exempt | 0.38% | 0.48% | 0.58% | 0.69% | 0.75% | 0.81% |
The Historical Performance of Our Trinity Portfolios
We update the historical performance data for our six Trinity portfolios each quarter. To review our most recent report, click here.
Curious How Meb Invests in Cambria’s Products?
Our co-founder, CEO/CIO Meb believes in “eating your own cooking” meaning he invests his own money in Cambria’s products. To learn more about exactly how he allocates, click here.